This section describes some of the terms and concepts of process mapping, modeling and analysis. At the end of the section you will find some free tools you can download to help you get started.
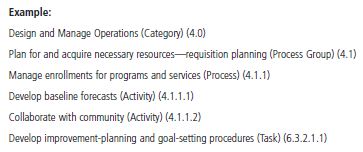
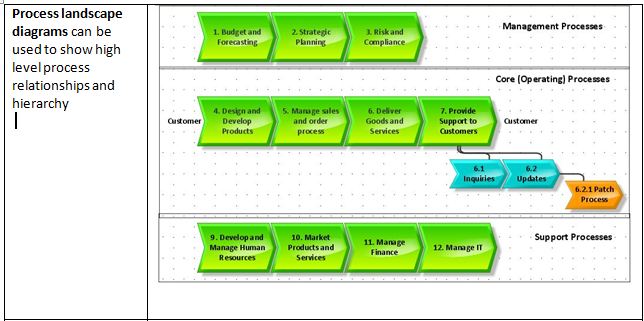
- Process Framework is a way to standardize the naming and numbering of your processes as well as a way to organize them in a hierarchy. It also expresses which processes are typically core to the value of the customer and which are supporting management processes.
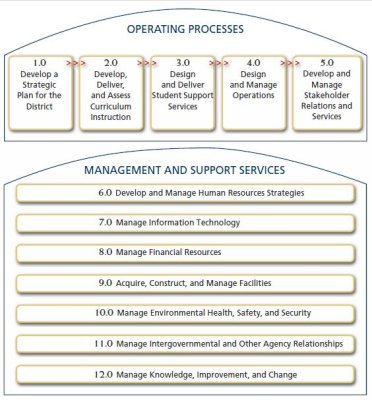
Example from APQC's Education Industry Process Framework
- Process Mapping - typically thought of as a static process flow diagram. For example, a white board illustration of a process or using sticky notes on a board to represent and organize process steps. Mapping is often used in initiatives like Lean.
- Process Modeling Unlike the illustration, a process model is a (less beautiful) flow
 diagram that shows the sequence of events and activities/tasks that occur in a process. A model is typically created in a software tool like Visio, Quality Companion or one of the numerous other modeling tools. These models capture not only the visual picture of the process, but also data about the steps in the process which can then be used for what-if analysis (what-if we had more resources, what-if we removed steps, etc.).
- Process Analysis is the use of different techniques for evaluating various aspects of a process, generally to uncover inefficiencies or other issues and determine ways to improve it. What-if analysis used in Modeling is a one form of analysis, but there are many techniques to analyze a process including simulation. (see below).
- Process Catalog/Repository is a location where all process models and associated electronic documents are maintained so they can be easily organized, searched, accessed and updated. Process repositories also often have access control that can regulate who can upload, modify and view process documentation. Repository tools are also adopting collaboration and social capabilities to allow users to collaborate on and work together on models in real-time.
Using visual aids to depict a process helps facilitate process understanding, not just because the end result is a picture, but because the process of noodling through process steps and decision points results in a much better understood process (by the analyst author) and is then much more readily communicated,
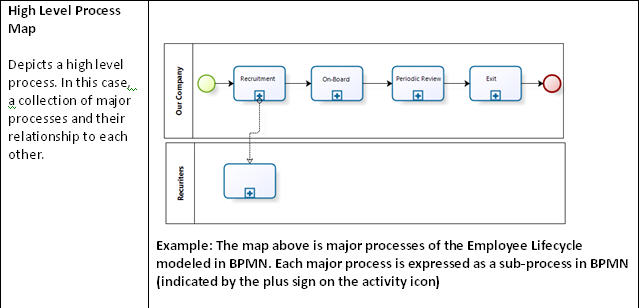
There are a large number and variety of process mapping, modeling. simulation and diagraming techniques. In BPM, the industry standard that has emerged for flow level modeling is Business Process Model and Notation (BPMN). BPMN is an excellent way to map out flows and process relationships to help document and communicate how a process is performed or should be performed.
Some critics feel the notation is becoming too complex for business users. While it is true there are many elements (icons, etc.) that are used in BPMN 2.0 compared to the original version 1.0 and that these can be a bit confusing, it's not necessary for a business user to understand every element (many of which are really required when the process is going to be automated directly from the notation) to effectively model a process using BPMN. The benefit to both groups is that it's a good "bridge" document between business users and IT. Business users can learn the basic elements and IT or Business analysts can fill in the details as might be needed if in fact the process is going to be automated.
BPMN has also been criticized that while it may do a good job of documenting how a process works, that it lacks a formal 'built-in' process analysis, that models only at the lowest procedural level and that it's just one of many process mapping methods. All that is true, which is why you should augmenting your modeling/analysis with other types of methods dependant upon the type of analysis you are performing.
Here are the basic process mapping and modeling techniques you should consider having in your BPM tool box and their purpose. (Of course for an IT or systems analyst there are other tools for data modeling, system interactions, use cases and so on, but that is not the focus of this site).
Some videos, articles and free software to help you get started. Also check out our BPMN aids page.
Tutorial Videos


Articles

Free Modeling Software

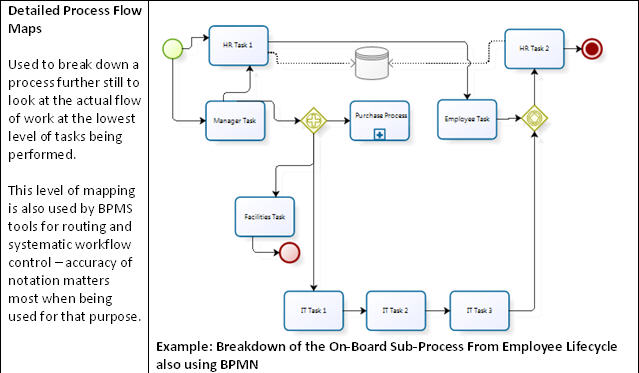
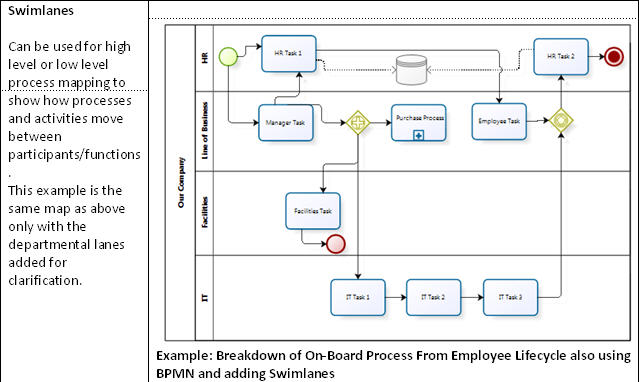
A simple and rather common sense approach to process analysis is to start by mapping out the flow of the current (as-is) process in BPMN and then look at each step in a process and ask fairly obvious questions such as: What are the current pains or challenges in the process?; Why are the process steps done?; How long do the steps take?; How much time delay is there between steps?; Are there steps that are redundant or unnecessary?. Through this simple exercise you can drive discussion with process participants to uncover opportunities for improvement and come up with a new future (to-be) process. You’ll also be able to take what you learn about your as-is process and what you want to accomplish in it’s overhauled to-be version and communicate those notions and specifications much more effectively with the process maps you developed.
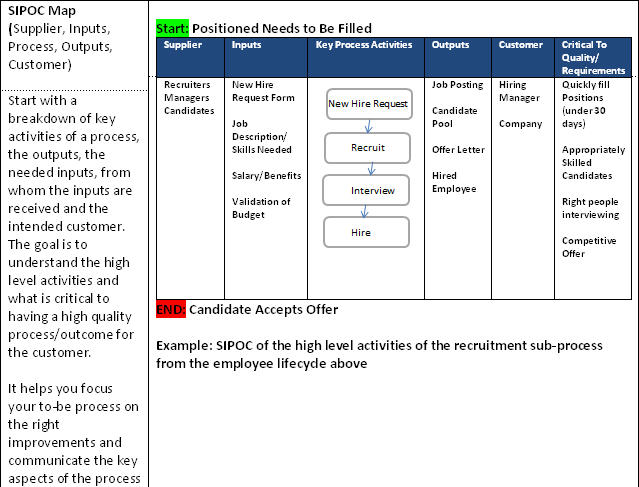
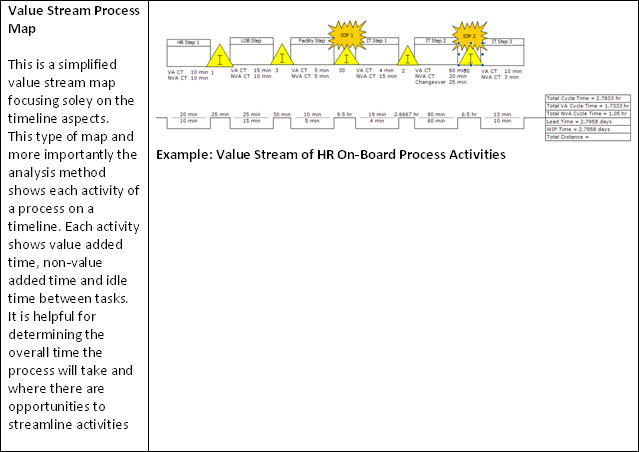
Formal techniques like Six Sigma or Lean can be very 'heavy weight' techniques that require significant expertise. There are however, some analysis techniques derived from these methods such as Value Stream Mapping and Sig Sigma SIPOC diagrams (Suppliers, Inputs, Process, Outputs, and Customers) that can be major aid in helping to perform process analysis and that do not necessarily require deep expertise in the broader methodologies. And you can also essentially combine techniques such as Value Stream Mapping concepts directly within a BPMN map. The point is to accomplish the task at hand and not be bound to the ideals of a given technique. Remember that if you want broad adoption and participation in process improvement, then everyone can’t and won’t be a deep expert in modeling methods. Embrace an approach that the broadest group can benefit from.
There is also a balance you need to strike when you plan to use BPM automation: you don't want to simply automate a bad, inefficient process, but at the same time, you don't want to spend too much time over-analyzing the current process either. Automation will inherently force redesign and a good BPMS methodology will include iterations and prototypes that will help flesh out and refine the to-be process.
Simulation is another modeling and analysis technique. First, process simulation is a way to see how a process will perform based on different scenarios. (“What if” we change this or change that.) It can be useful when designing a new process to project required resources or analyze existing processes to understand the impact proposed improvements might have on the process.
With process simulation, you most often start with a flow diagram that represents the steps in the process. Then you add information to the map/simulation tool that includes the number of resources that may be available to perform various steps, the costs associated with those resources, the amount of time you want the simulator to run for (a week, a day, etc.). Then, these tools will “run” scenarios to simulate the actually performance of the process and offer up results.
Results might include the cost to run the process for a given period of time, the amount of items you can process with your current resources, the average time it might take for the entire process to complete or the completion time for a given step in the process. These tools also show flow patterns and where bottlenecks occur in the process.
Process simulation methods and tools can vary significantly in complexity and the types of simulations they can perform. They can be extremely beneficial when trying to model high volume processes where eking out even minutes can save thousands or even hundreds of millions of dollars. Keep in mind however, especially for basic business process analysis, that the more complex simulation tools may be overkill. They may require more skill and knowledge than you might realize or be willing to invest in. The more complex tools require a good understanding of statistical methods, they must be fed high quality, well screened data and they may require advanced modeling skills.

Process Performance Measures Typically Used in Analysis and Simulation:
 Process Capacity - maximum output rate (output per unit of time)Throughput Rate - average rate at which things can flow thru a point (X per unit of time) with the maximum being the Process CapacityThroughput Time - the average time that an item takes to flow end to endProcessing Time (working time) - the average time that work is actually being performedIdle Time (waiting time) - the time when no work is being performedWork in process - the number of items presently being worked on through the steps of the processSet-up time - the time needed to prepare something to be processedLabor Utilization - the faction (%) of labor that actually is utilized as direct labor